Fish with
signals.
Real-time environmental intelligence that tells you why fish are where they are — and what to do about it.
Where it started
A ten-year-old, a walleye,
and a warning.
A ten-year-old fishing a rickety old pontoon boat with his grandfather on the Wisconsin River pulls up a prize walleye — already dreaming about fried walleye and Grandpa's homemade french fries.
Grandpa cuts the moment short. He points to a large brown spot on the fish's tail, clearly out of place. “No,” he says. “We can't eat this one. The river's too polluted.”
The boy slides the walleye back into the river — and from that day on, looks twice at every fish he'd ever pull out of the water again. His family wouldn't eat a fish caught from that river for over twenty years.
The river was already on the EPA's most dangerous list.
And it had been for years before anyone told the families fishing it.
That same stretch of the Wisconsin River sits directly over what the federal government classified as a in 1985. Industrial solvents from a municipal landfill and a chemical facility on its banks had been leaching into the groundwater for years, contaminating six municipal wells that supplied drinking water to 35,000 people.
Forty years later, the story has a second chapter. The city of Wausau has now spent $17 million building a filtration system to remove — a different class of contamination that wasn't even being tested for when the original cleanup began. Groundwater beneath a nearby 3M facility has tested at 925× the proposed state safety limit. Water bills for 40,000 residents have nearly doubled. A class action lawsuit is heading to trial in 2027.
This is exactly the kind of problem that continuous, distributed water quality monitoring is built to catch early — before it takes four decades and tens of millions of dollars to address. It's the reason Nemo's Eye exists.
The Hardware
What you're looking at.
A waterproof controller box mounted above the waterline, connected by a single bundled cable to a sealed smart probe below.
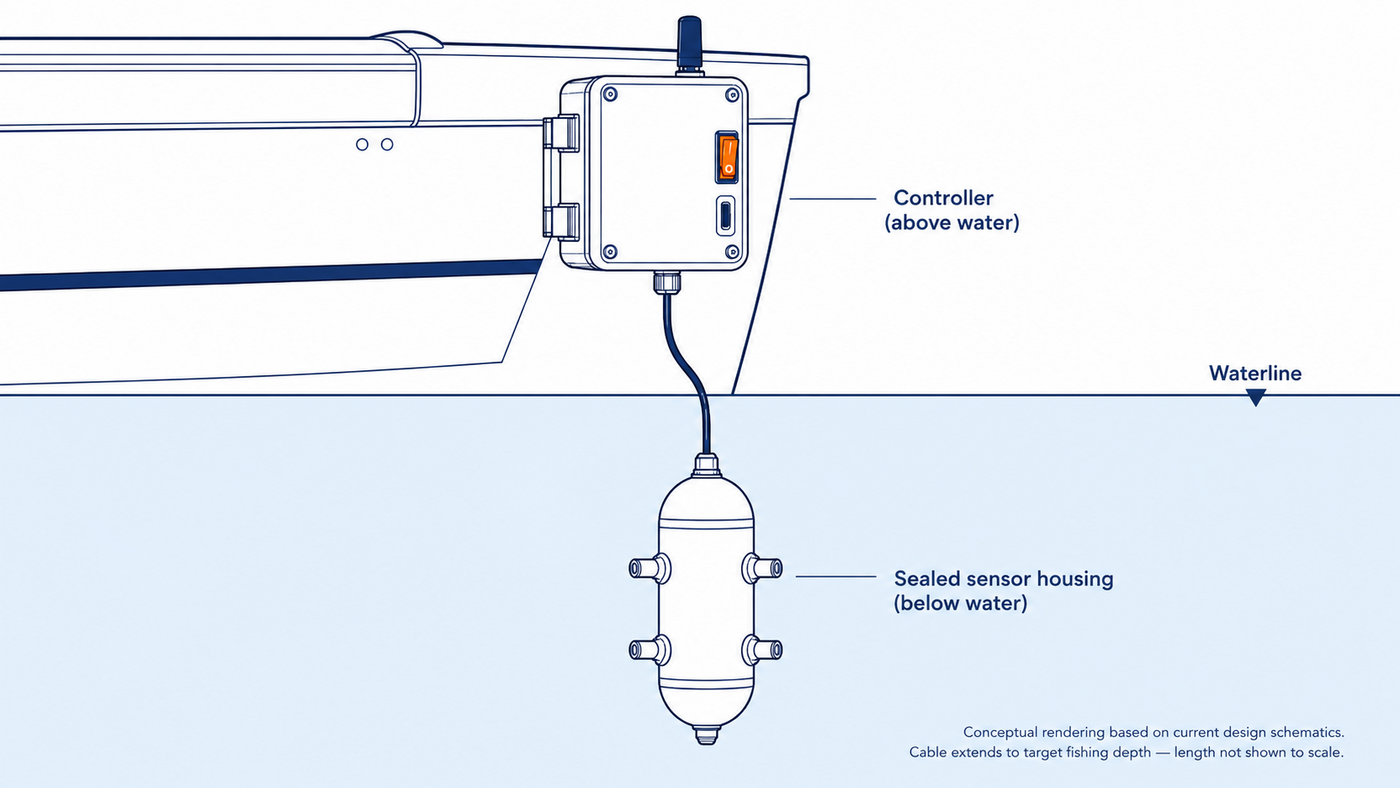
Conceptual rendering — current design schematics, not final production hardware.
Environmental Sensors
Dissolved oxygen, water temperature at depth, turbidity, depth, and barometric pressure — the variables peer-reviewed fisheries research confirms drive fish behavior.
Three Independent Data Paths
Bluetooth 5.0 streams live to your phone. WiFi pushes to the cloud. LoRa mesh relays through any nearby unit when there's no cell signal — no dead zone permanently loses data.
Intelligence Engine
Works offline from the first cast — science-backed rules, no internet required. Cloud AI sharpens the read further when connected. Every session makes it smarter for everyone.
Mobile App
Live depth profiles, plain-language species recommendations, catch logging, GPS-tagged session history, and community insights. iOS and Android.
Fish Finder IntegrationSoon
NMEA 2000 connects to your existing fish finder — sonar and environmental data in one view. Where the fish are AND why they're there.
Conservation Data
Every session generates anonymized, GPS-tagged water quality data feeding cooperative partnerships with agencies and conservation organizations. You don't do anything extra.
The App
Depth profiles, not guesswork.
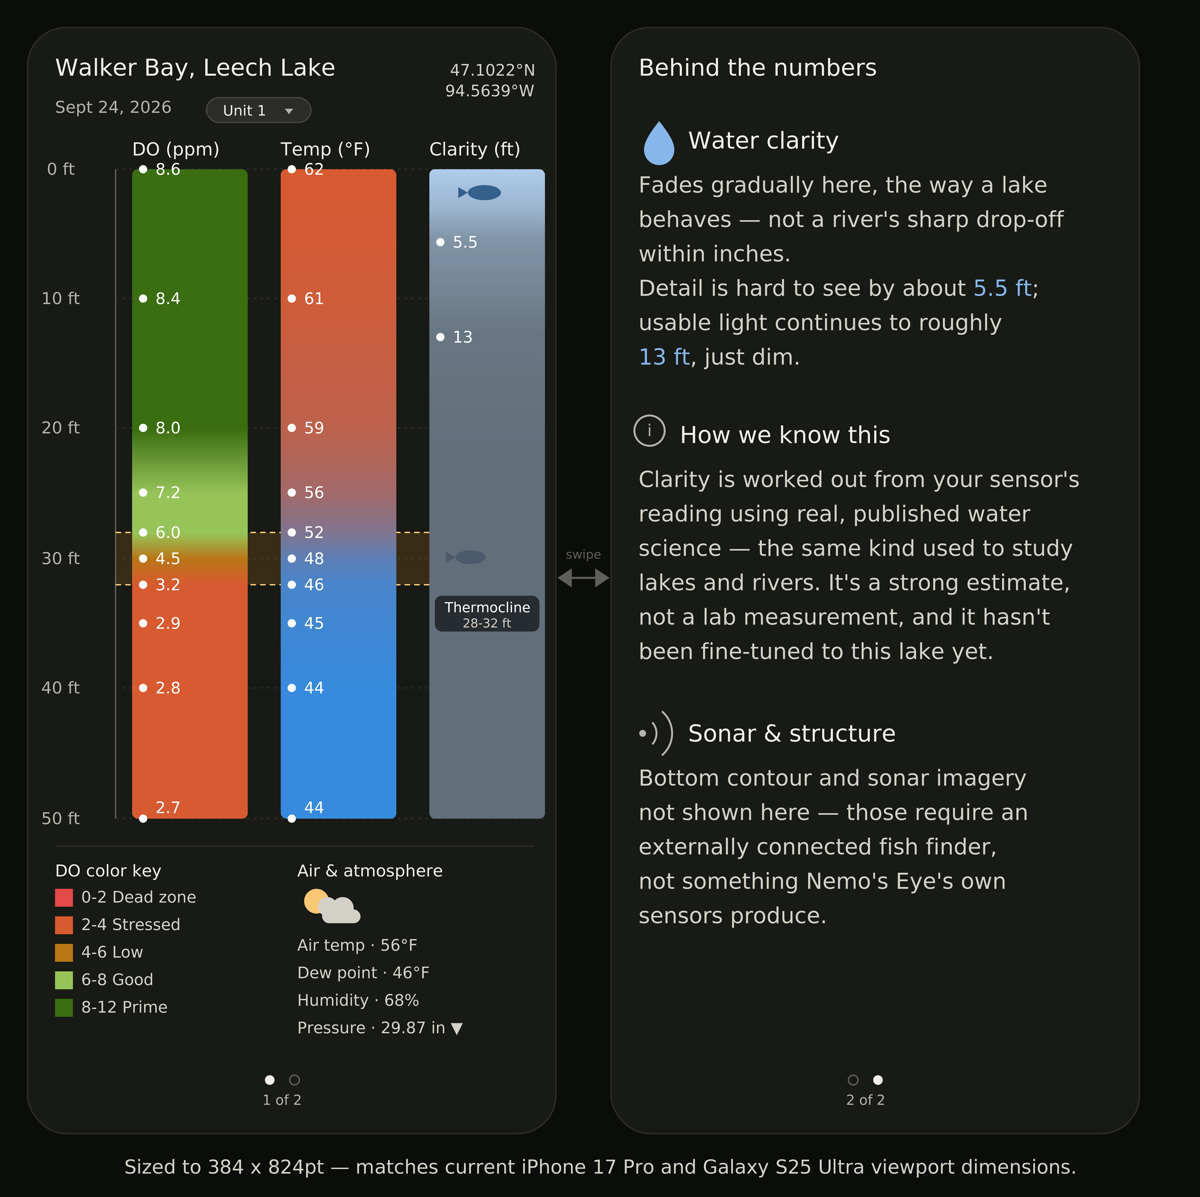
See what's happening at every depth — dissolved oxygen, temperature, and water clarity as continuous profiles. Tap any reading for a plain-language explanation of why it matters and how it was calculated.
How It Works On The Water
Every reading tells a story.
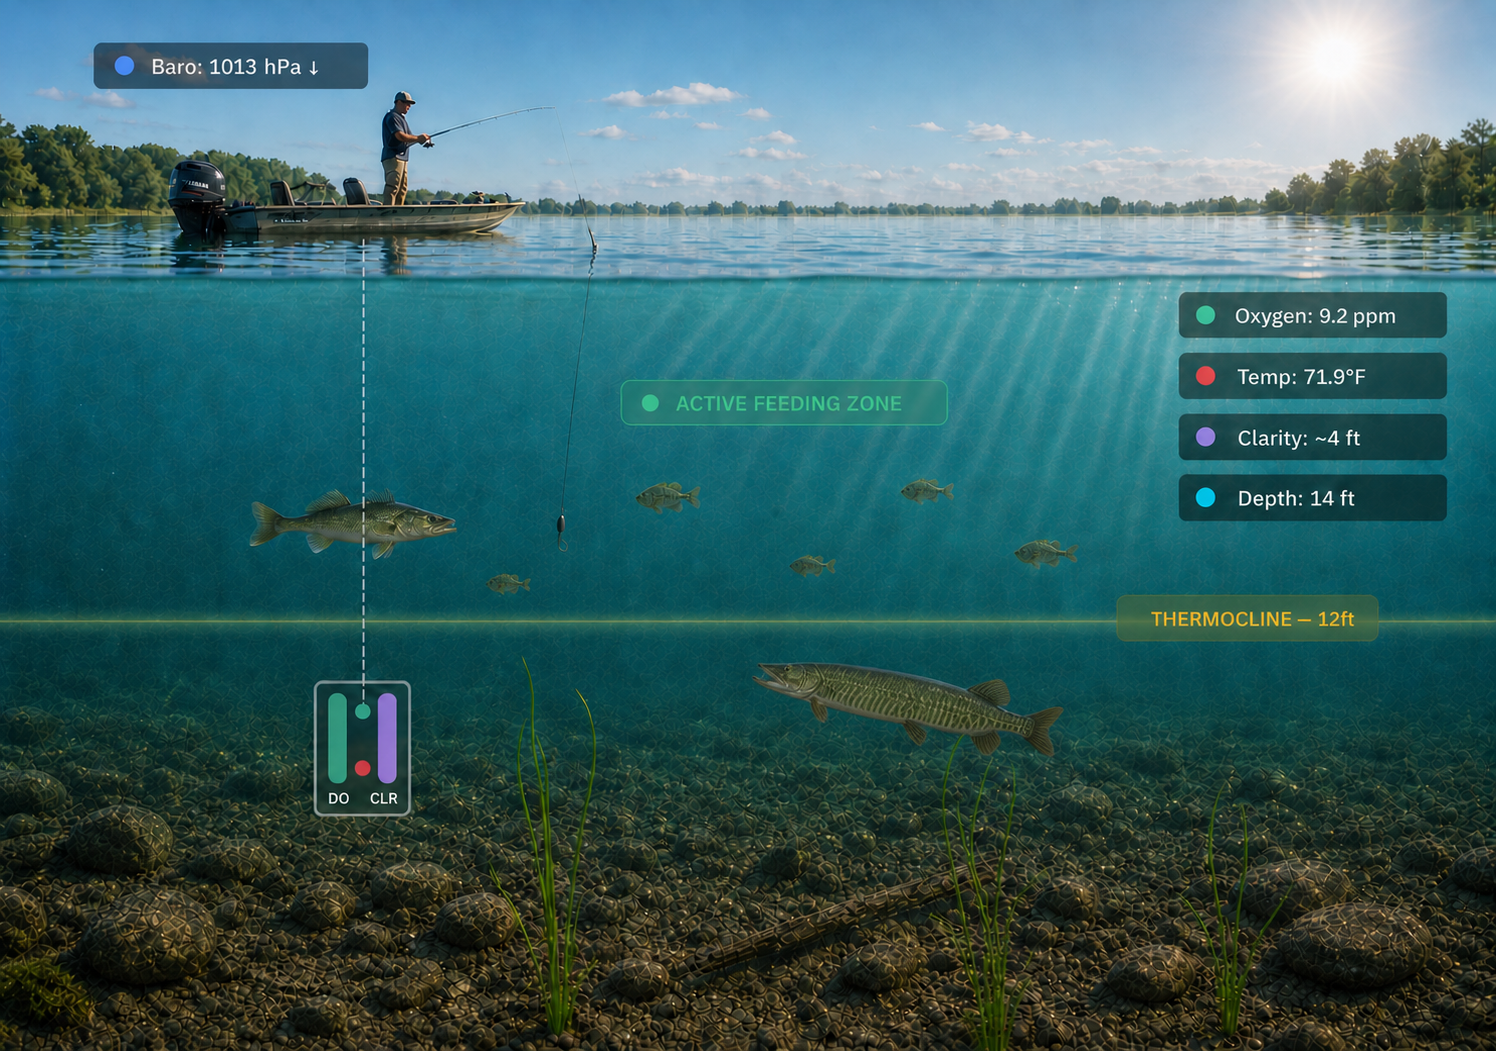
Conceptual illustration — sensor overlay positions and data readouts are representative.
What the smart probe measures — and why it matters.
Dissolved Oxygen (DO)
Measures oxygen concentration at depth in parts per million.
Why it matters: Below ~4 ppm, most gamefish physically can't sustain activity. Above 7 ppm, conditions are prime. DO determines where fish can be — not just where they might be.
Water Temperature at Depth
Reads temperature continuously from surface to smart probe depth — not just a surface reading.
Why it matters:Every species has a preferred thermal range. Surface temps lie — a lake reading 75°F on top can be 58°F at 20 feet. The depth profile reveals the real thermal structure.
Water Clarity (Turbidity)
Measures suspended particles that affect light penetration and visibility.
Why it matters: Clarity drives presentation. Clear water demands finesse tactics and natural colors. Stained water calls for vibration, noise, and contrast. The smart probe tells you which approach to use before you tie on.
Thermocline Detection
Calculated from the temperature profile — the boundary where warm surface water meets cold deep water.
Why it matters:The thermocline is the single most important structure that doesn't show on sonar. Fish stack along it because oxygen, temperature, and food converge there. The intelligence engine finds it automatically.
Barometric Pressure
Measured by the controller box above the waterline — continuous trend tracking, not just a snapshot.
Why it matters: Falling pressure often triggers aggressive feeding. Rising pressure slows it. Stable pressure means pattern fishing. The trend direction matters more than the number itself.
Active Feeding Zone
Calculated by the intelligence engine — not a single sensor but the intersection of all of them.
How it integrates: The engine identifies where DO, temperature, and clarity all fall within the preferred range for your target species — then factors in pressure trends and thermocline position. The result is a specific depth range and approach, in plain language. No charts to interpret.
Nemo's Eye Sporting
The consumer product.
Drop the smart probe in, open the app, and your phone tells you what depth to fish, what to throw, and whether conditions favor an aggressive or finesse approach — for the species you're targeting.
Works offline from the first cast. Gets smarter with every session — yours and the broader community's — without ever exposing anyone's spot.
Every session on the water helps build a shared picture of water health across the lakes you fish. Same tool, both missions.
Nemo's Eye Research
A separate product line — built on what Sporting proves.
Targeted deployment for agencies, universities, and conservation organizations. Separate hardware, separate pricing, sited specifically for a research question, never touching angler data.
Prove the hardware
Thousands of consumer units validate smart probe reliability, battery life, waterproofing, and connector durability in real conditions. The track record is built by anglers, not lab tests.
Validate the methodology
Fleet-scale data demonstrates that readings from many consumer devices produce statistically valid signals. Outliers flagged, not published. Confidence intervals earned, not assumed.
Deploy with partners
Research-grade units go to specific sites chosen for specific questions — supported by agencies and universities who helped shape what to measure. Shared through cooperative research agreements.
Why This Is Different
Fish finders show where.
Nemo's Eye shows why.
Existing tools show you what's under the boat. None of them explain the environmental conditions driving fish behavior — or tell you what to do about it.
Fish Finder
Shows where
Depth contours and marks that might be fish. Great for locating structure and seeing what's below the boat. Can't tell you why fish are at that depth or whether they're likely to bite.
Underwater Camera
Shows what
Exactly what's in front of the lens — species ID, behavior, structure detail. Narrow field of view, affected by clarity, tells you nothing about conditions outside the frame.
Nemo's Eye
Shows why — tells you what to do
Measures the conditions that determine fish behavior — oxygen, temperature, thermocline, clarity, pressure — and translates them into species-specific recommendations in plain language. Plus every session generates conservation data.
See Nemo's Eye in Action
Founder
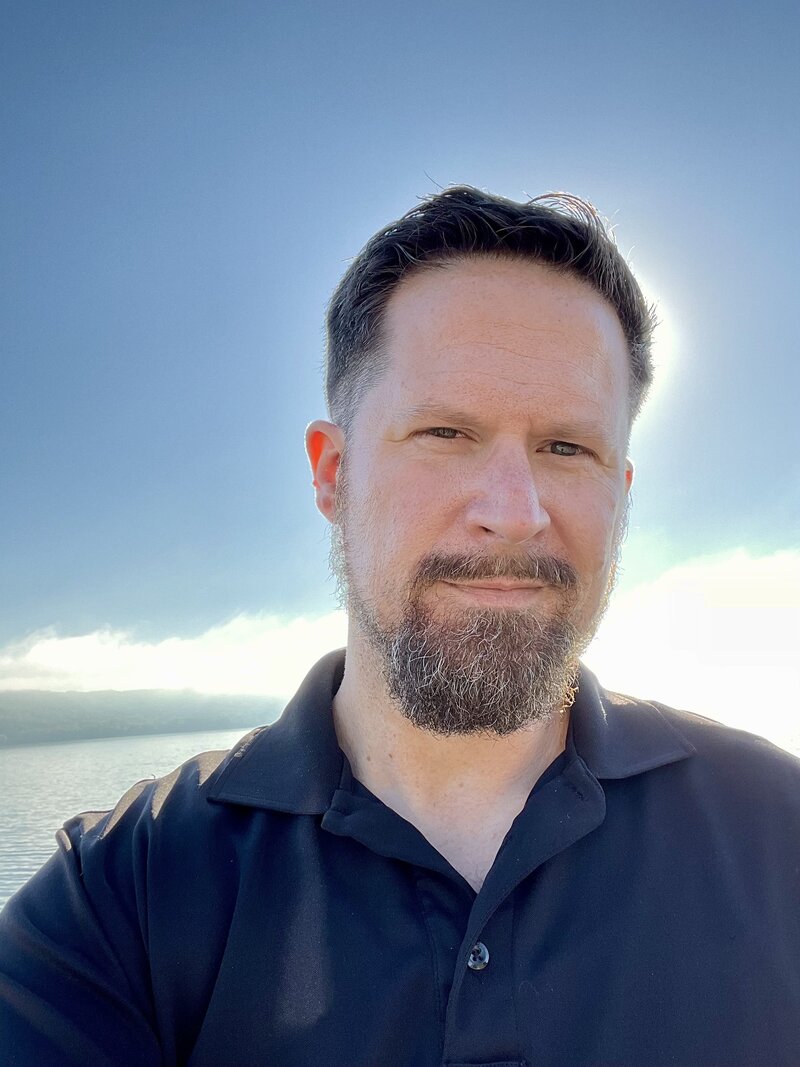
Tyler Roden
U.S. Navy veteran. Grew up fishing the Wisconsin River in central Wisconsin — the same water that sits on top of a federal Superfund site listed since 1985.
Nemo's Eye started from a simple frustration: every piece of fishing technology on the market shows you where fish might be, but none of it explains why they're there or what to do about it. The science exists. It just hadn't been put in an angler's hands in a way that makes sense on the water.
The conservation mission came naturally. If thousands of anglers are already collecting environmental data every time they fish, that data should help protect the resource — not just improve the catch.
Advisor
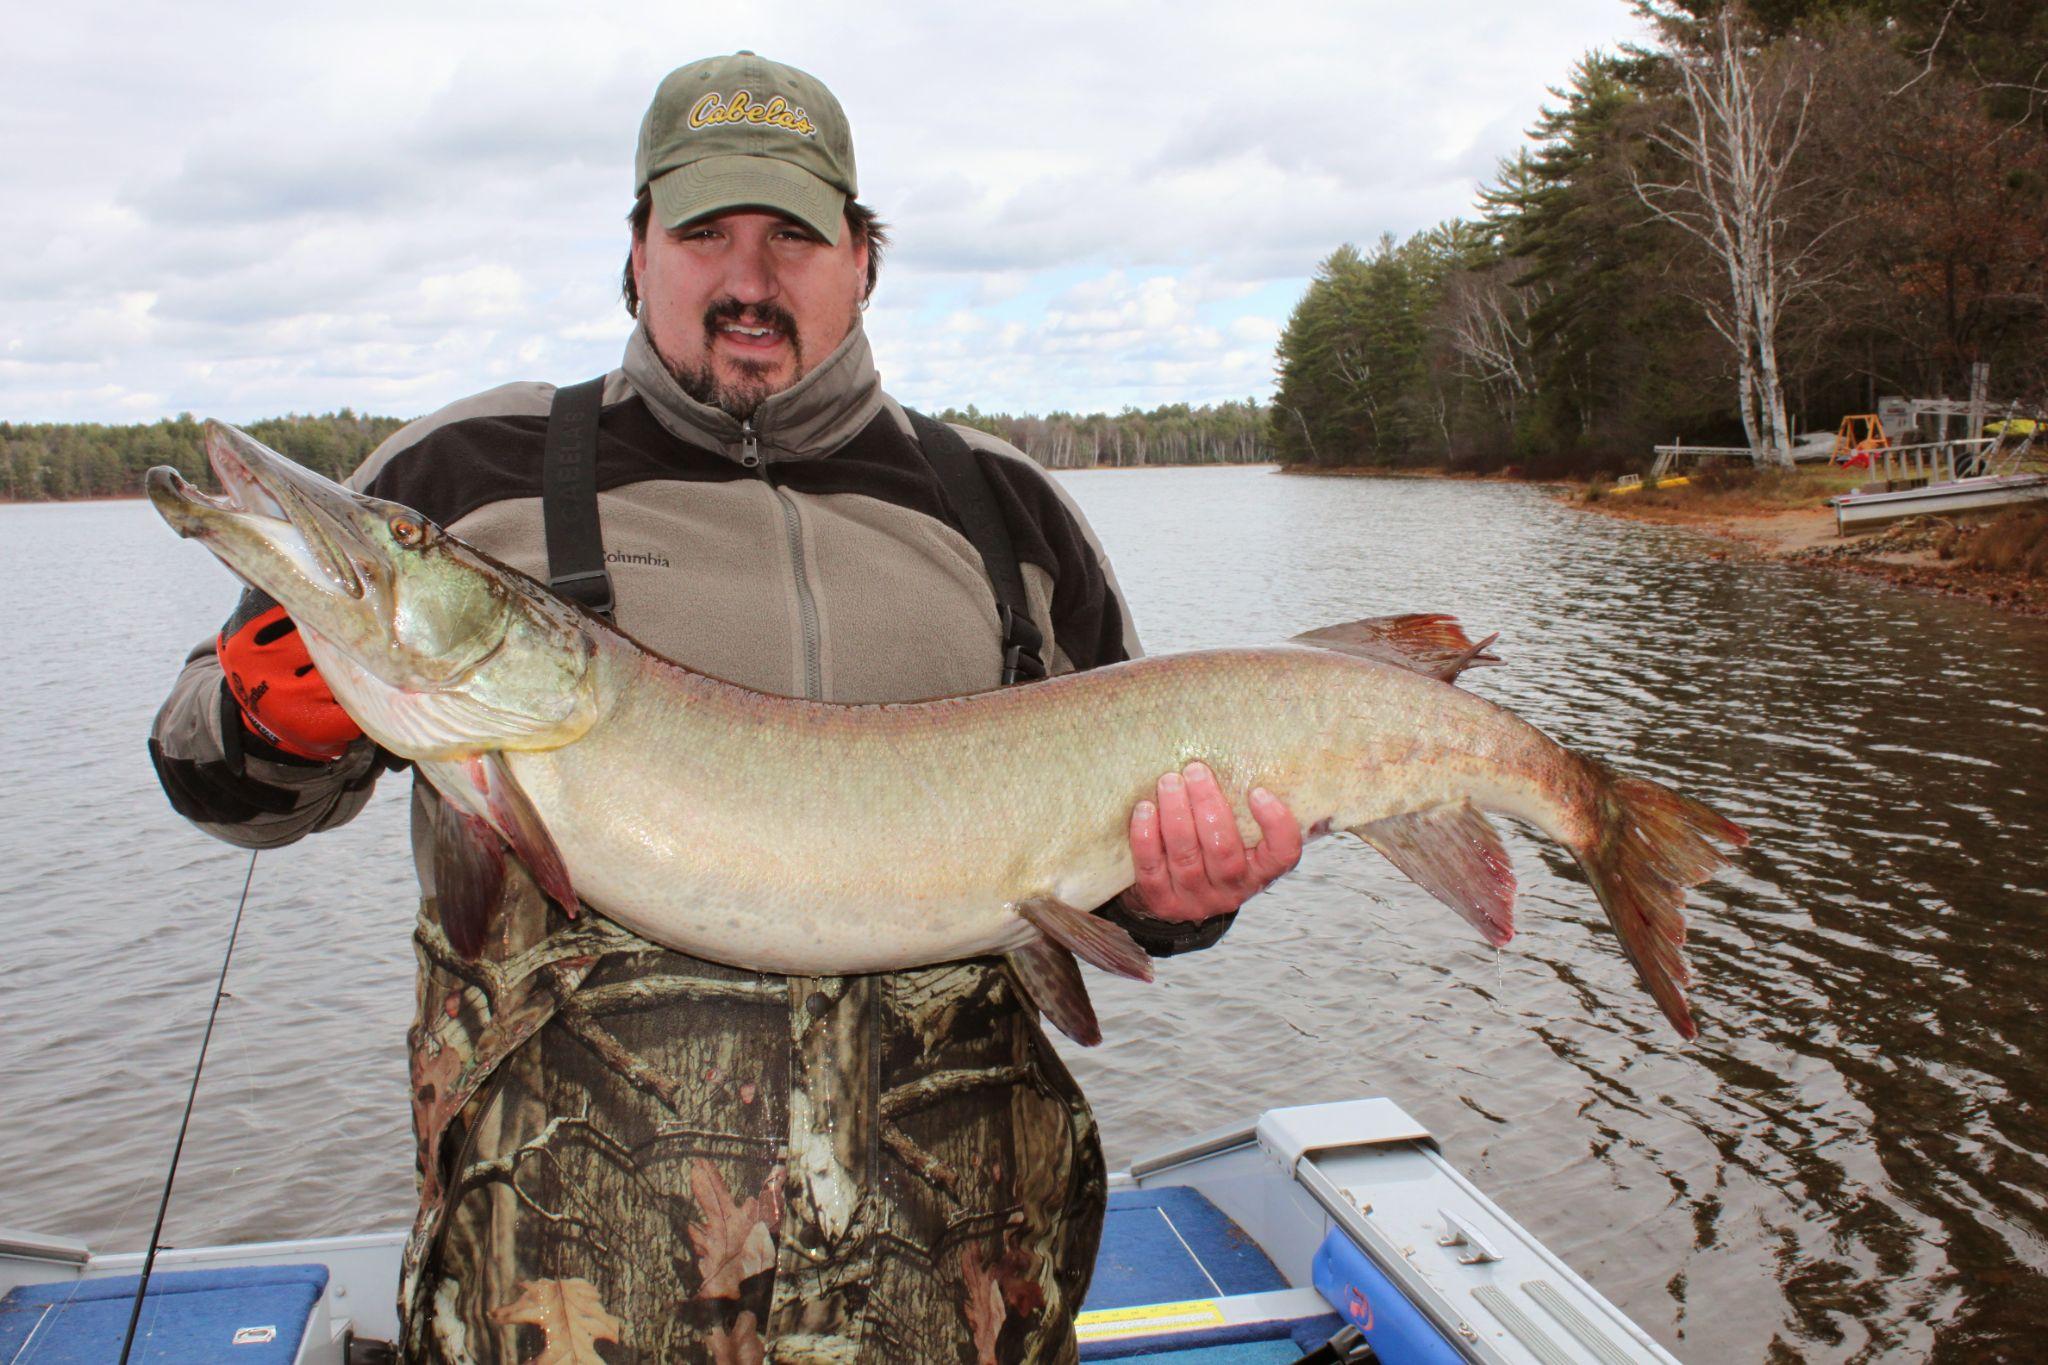
John Hoopman
John Hoopman has the kind of academic record that opens doors well outside a classroom — advanced degrees in biology and curriculum design from three University of Wisconsin campuses. He became a teacher because he's passionate about science, education, and passing that knowledge on to the next generation — and twenty-five years in, it shows: he runs a citizen-science water-quality program on Wisconsin's Mullet River, matched by a lifetime of serious fishing on that same water. When Tyler first walked him through Nemo's Eye, John's input planted the seed for what is now the sensor app display.
Be first on the water.
Join the waitlist — we'll let you know when Nemo's Eye is ready.